
OpenAI and Anthropic have added about $74B in new revenue this year, while every public software company combined is expected to add around $63B. That's one slide out of 90 in a16z's new State of Markets report.
I went through all of it and picked the charts worth your time. 🧵👇
1/n

2
4
331
Tech is about 35% of the world's 100 biggest listed companies by count, but around 60% by market cap (excluding China). Fewer names than you'd expect, carrying a lot more weight than they used to.
2/n

2
1
13
Earnings tell the same story. Tech makes up nearly half of S&P 500 profits, its earnings have grown about 3.8x more than non-tech, and it delivered roughly 76% of the index's earnings growth. The rest of the market is mostly along for the ride.
3/n

1
1
11
The bubble question. a16z's answer is that profits are doing the work, not prices. Earnings per share keep climbing while the price to earnings ratio drifts down, and tech earnings growth has hit around 70%. You can disagree, but it's a real argument.
4/n

1
7
Hyperscaler capex: $97B in 2020, $416B in 2025, about $777B this year, and roughly $1.1 to 1.2 trillion a year from 2027. Every computing era has been bigger than the one before it, and this one is the biggest yet.
5/n

1
7
The catch is cash. Capex is eating hyperscaler free cash flow, and the report expects it to stay squeezed until around 2028. Debt markets have stepped in. The case for calm is that returns on these investments are still above the cost of borrowing.
6/n


1
8
A side effect I didn't see coming: the buildout has set off a run on skilled trades. Construction employment in data center exposed categories is up by more than 300,000, and those jobs pay a clear premium over the same roles elsewhere.
7/n

1
7
One that goes against the headlines. A study cited in the report found data centers may be lowering power bills, not raising them. Where capacity grew 160% from 2019 to 2024, residential rates fell about 6%. One study, so a data point and not a verdict.
8/n

1
7
On the demand side, OpenAI and Anthropic combined are heading towards roughly $135B in annualized revenue. The chart says the two labs have added about $74B of new revenue so far this year, more than all public software companies are expected to add ($63B).
9/n

1
8
The bears said older GPUs would be worthless once the next generation arrived. The report's chart shows rental prices and resale values for even the oldest chips holding steady or climbing, which makes long depreciation schedules look less like an accounting trick.
10/n

1
5
The number I keep coming back to. 69% of S&P 500 companies say they have a live AI deployment. Only 2% disclose a metric they track over time. Everyone is using it, and almost nobody is measuring it.
11/n

1
5
On jobs: at companies adopting AI heavily, the entry-level share of headcount went up about 1.15 points on average. At light adopters it fell 0.52. US tech hiring is also running above trend. Correlation, not proof, but not the story most people expected.
12/n

1
8
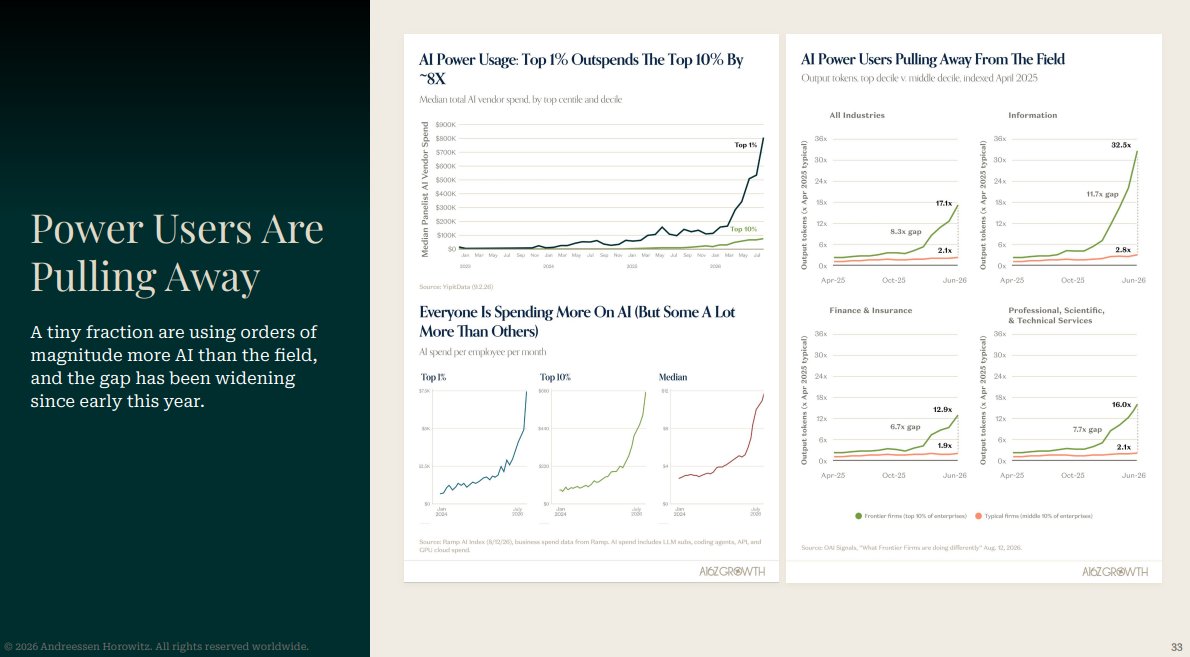
Usage inside companies is lopsided. The top 1% of users spend about 8x more on AI than the top 10%, and the gap has been widening since early this year. A small group of power users is pulling away from everyone else.
13/n
1
2
Cheaper intelligence, more demand. Token prices keep falling, yet GPU rental prices have been rising. It's the Jevons paradox playing out in real time: the cheaper it gets to use, the more of it people use.
14/n

1
9
OpenRouter's data shows it. Weekly tokens went from 4.7T last September to 126T this September, about 27x in a year, and demand has doubled twice since June. Agents are a big reason, since they use far more tokens than people do.
15/n


1
2
Who captures the money? On OpenRouter, Anthropic, Google and OpenAI take about 70% of spend on only 35% of the tokens. Everyone else has 65% of tokens but 31% of spend. Open models are growing fast, but still a tiny slice of total spend.
16/n

1
5
Atoms are back too. Waymo went from 10,000 paid rides a week in August 2023 to about 500,000 now. That's roughly 50x in under three years, with new cities opening every few months.
17/n

1
3
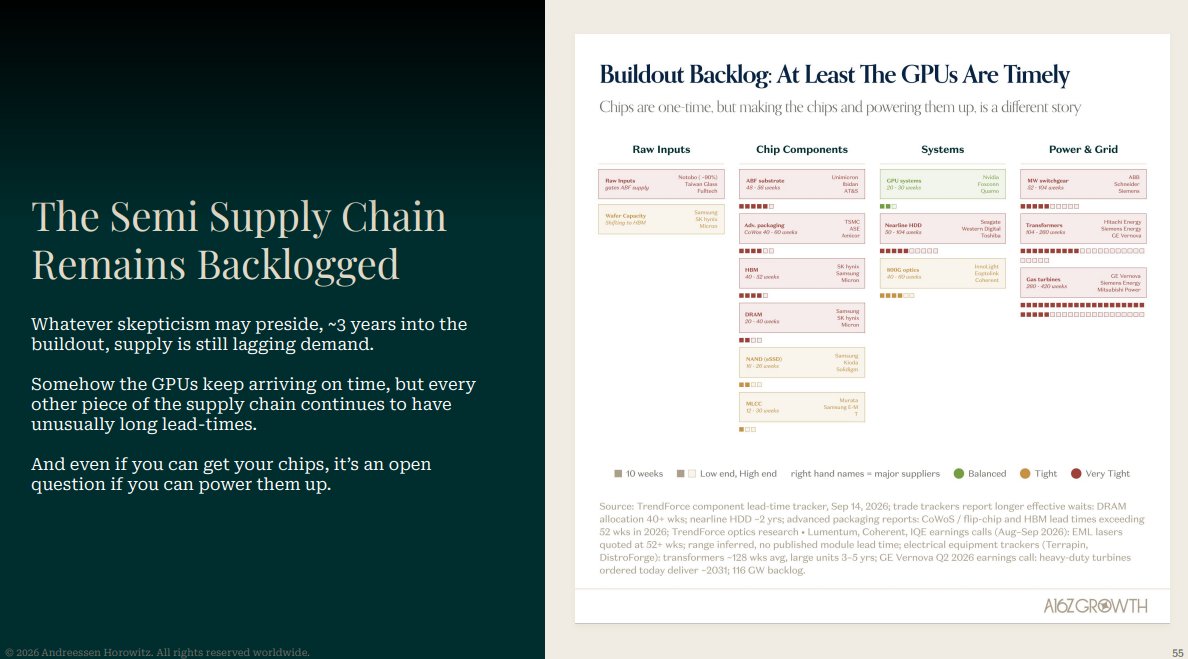
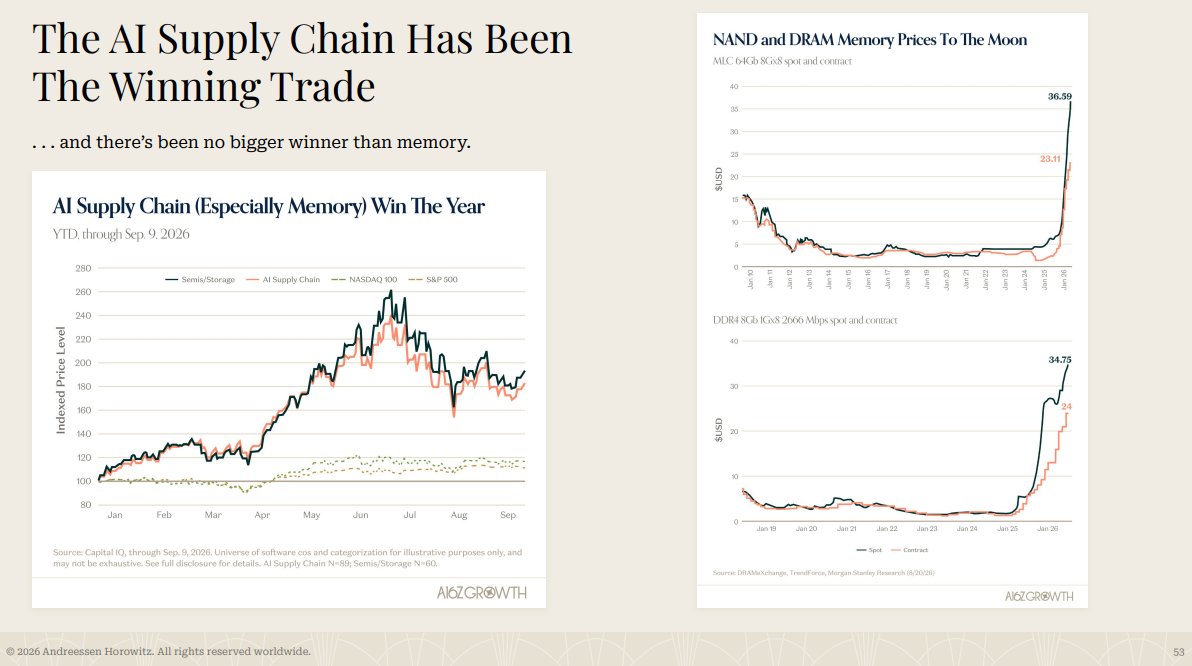
The AI supply chain was the winning trade this year, and nothing beat memory, with NAND and DRAM prices going almost vertical. Three years in, the GPUs arrive on time but nearly everything around them has long lead times, and power is still a question mark.
18/n
1
11
Software is the other side. 2026 opened with the SaaSpocalypse sell-off, but a16z calls what followed "prove it" and not apocalypse. Multiples came down while growth and operating leverage held up, and Stripe's data even shows SaaS revenue accelerating.
19/n


1
9
My favorite chart in the software section: newspaper stocks sold off about five years before their earnings collapsed. Markets can price in decline early. The open question is whether software is the new print media or gets lifted by AI.
20/n

1
4
Now the private side. VC-backed exit value this year is already about $2.2 trillion. The previous record was roughly $860 billion in 2021. Exits are happening on a scale that's in a different league.
21/n

1
1
The five biggest private companies are now worth about $2.2T together, more than the entire last decade of tech IPOs combined at around $1.73T. Active US unicorns are worth $5.34T, ahead of the whole Russell 2000 at $3.5T.
22/n


1
1

Startups born in the AI era grow differently. Top AI apps are growing about 5x a year off a smaller base ($1M to $30M of revenue) and about 2.5x off a larger one ($30M to $200M).
24/n

Oct 1, 2026 · 8:02 PM UTC
1
18
